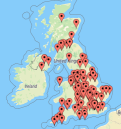
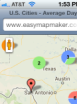
Create a Custom Map in 3 simple steps:
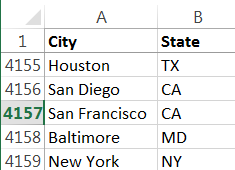
- Copy and Paste your spreadsheet data into the table, or drag your excel file into the table (or use one of our samples).
- Set Options (Optional if the address information can be identified with column headers)
- Click "Make Map".
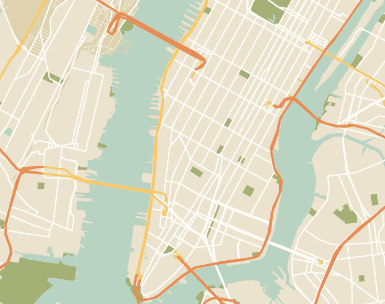
Set Custom Map Style
Create your own map style:
- Go to Google's map styling wizard (https://mapstyle.withgoogle.com/)
- Select the various options on that site to get the style you want
- Click "Finish"
- Copy the JSON and paste it into the form
Map Style (JSON text)
Sample marker description
Custom Images (show)
Choose items to show in marker description (show)
| |
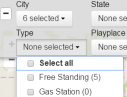
Filters: Select up to 12 columns for filtering (show)
Search Box Customizations (show)
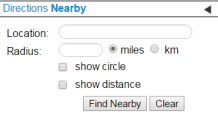
Location based search:
Select Searchable items
Radius Around point (show)
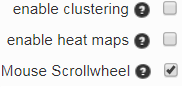
Cluster Customizations (show)
| Select Column | Values to Exclude |
|---|---|
| Minimum Count | Maximum Count | Color | Remove |
|---|---|---|---|
Set Custom Map Style (show)